Statistics Calculator
The SolversPro Statistics Calculator is a free browser-based math utility that evaluates arithmetic mean, median, mode, variance, and sample standard deviation for any numerical dataset in real time.
Enter your numbers separated by commas below to generate an instant statistical summary with formulas and step-by-step breakdowns.
How to Use This Statistics Calculator
Input Your Numbers
Type or paste your data into the box separated by commas. Decimals and negative numbers are fully supported.
Run Instant Analysis
Click Calculate Stats. The statistics calculator computes mean, median, mode, variance, and standard deviation in milliseconds.
Review & Save
Examine the metrics cards and save your computation history directly to your private local dashboard with one click.
Worked Example: Step-by-Step Calculation
To see how this statistics calculator works under the hood, let us solve the default sample dataset: 5, 10, 15, 20, 25.
Step 1: Determine Count and Total Sum
Count the total items (N) and sum all values together.
N = 5
Sum = 5 + 10 + 15 + 20 + 25 = 75
Step 2: Find the Arithmetic Mean (Average)
Divide the sum of all elements by the total count N.
Mean (x̄) = 75 / 5 = 15.0000
Step 3: Locate the Median and Mode
Sort the values from smallest to largest and pick the center number. With 5 values, the 3rd item is the median. Every number appears once, so there is no mode.
Median (x̃) = 15.0000
Mode = None (all values appear once)
Step 4: Calculate Sample & Population Variance and Standard Deviation
Subtract the mean (15) from each observation, square the results, sum them, and divide by (N - 1) = 4 for a sample or N = 5 for a population.
(5 - 15)² = 100, (10 - 15)² = 25, (15 - 15)² = 0, (20 - 15)² = 25, (25 - 15)² = 100
Sum of Squared Deviations = 100 + 25 + 0 + 25 + 100 = 250
Sample Variance (s²) = 250 / (5 - 1) = 62.5000 | Sample Std Dev (s) = √(62.5) ≈ 7.9057
Population Variance (σ²) = 250 / 5 = 50.0000 | Population Std Dev (σ) = √(50) ≈ 7.0711
Core Concepts of Descriptive Statistics
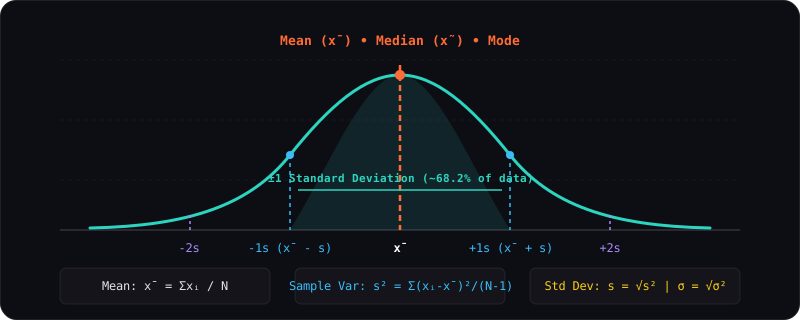
Descriptive statistics summarize and describe the features of a specific collection of information. Instead of drawing conclusions about a larger population, descriptive measures give you an immediate picture of what your dataset looks like.
Measures of Central Tendency
Central tendency identifies the center point or typical value in a dataset. The mean provides the mathematical balance point, the median reveals the middle ranking value, and the mode identifies the most frequent observation.
Measures of Dispersion
Measures of spread show how scattered data points are around the center. Range shows the extreme boundaries, variance calculates average squared distance, and standard deviation translates that spread back into original measurement units.
Descriptive Statistics Metric Reference
Standard mathematical definitions and formulas for univariate summary statistics.
| Statistical Metric | Mathematical Notation | Description | Formula |
|---|---|---|---|
| Mean (Average) | x̄ (x-bar) | Central tendency via total sum divided by count | Σxᵢ / N |
| Median | x̃ | Middle value when observations are sorted | 50th Percentile |
| Mode | Mo | Most frequently occurring value(s) | argmax(Frequency(xᵢ)) |
| Sample Variance | s² | Mean squared distance from mean with Bessel correction | Σ(xᵢ - x̄)² / (N - 1) |
| Sample Std Deviation | s | Square root of sample variance in native units | √(s²) |
| Population Variance | σ² | Mean squared deviation across an entire population | Σ(xᵢ - μ)² / N |
| Population Std Deviation | σ | Square root of population variance in native units | √(σ²) |
Frequently Asked Questions
What does this statistics calculator compute?
This statistics calculator computes key descriptive summary statistics for any dataset of numbers, including sample count (N), sum, arithmetic mean (average), median, mode, sample variance (s²), population variance (σ²), and sample standard deviation (s).
What is the difference between sample variance and population variance?
Sample variance divides the sum of squared deviations by (N - 1) to provide an unbiased estimator of variance for a sample (Bessel's correction). Population variance divides by N, assuming the dataset contains every member of the population.
When should I use median instead of mean?
Use the median when your dataset contains extreme outliers or has a skewed distribution (such as income or housing prices), as the median represents the 50th percentile and is resistant to distortion from outlier values.
Can this calculator process negative numbers and decimals?
Yes. The calculator parses floating-point numbers, negative values, and zero seamlessly from your comma-separated input list.
How do I calculate standard deviation with this statistics calculator?
Simply enter your comma-separated numbers into the data input field and click 'Calculate Stats'. The statistics calculator instantly calculates the sample standard deviation by finding the square root of the sample variance.
Is this online statistics calculator completely free to use?
Yes. The SolversPro statistics calculator is 100% free with no registration, no subscriptions, and all math runs locally in your web browser for complete data privacy.
Share & Embed
Paste this snippet into your blog, school portal, or website to embed the live Statistics Calculator:
<iframe src="https://solverspro.com/math/statistics-calculator/?embed=1" width="100%" height="620" style="border:1px solid #27272a;border-radius:12px;background:#0a0a0f;" loading="lazy" title="Statistics Calculator — SolversPro"></iframe>
<p style="font-size:12px;margin-top:6px;font-family:sans-serif;">Powered by <a href="https://solverspro.com/math/statistics-calculator/" target="_blank" rel="noopener">Statistics Calculator — SolversPro</a></p>
<a href="https://solverspro.com/math/statistics-calculator/" target="_blank" rel="noopener">Statistics Calculator — SolversPro</a>
Similar Tools
Age Calculator
Calculate your exact age in years, months, days, and discover your next birthday countdown.
Explore →Random Number Generator
Generate random numbers within a specific range instantly. Support for multiple numbers, decimals, and custom separators.
Explore →Scientific Calculator
Advanced math functions including trig, logarithms, and constants for STEM work.
Explore →